TikTok Shop Ad Analytics: What Separates Winning Brands From Wasting Spend
TikTok Shop ad analytics have moved beyond views and clicks. Here is what serious operators track and what to demand from your agency.
TikTok Shop brands burning the most ad budget are the ones flying blind on creative performance.
In 2026, TikTok advertising is no longer a content game. It is a data game. Brands that treat TikTok Shop like a social media channel instead of a conversion channel are leaving 30 to 50 percent of their potential ROAS on the table. The operators who win are the ones with real ad intelligence: product-level attribution, creative diagnostics, and competitive visibility updated in near real time.
If your agency cannot tell you which specific creative drove which SKU's revenue last week, you are not working with a serious TikTok Shop operator.
Why Standard Metrics Are Not Enough on TikTok
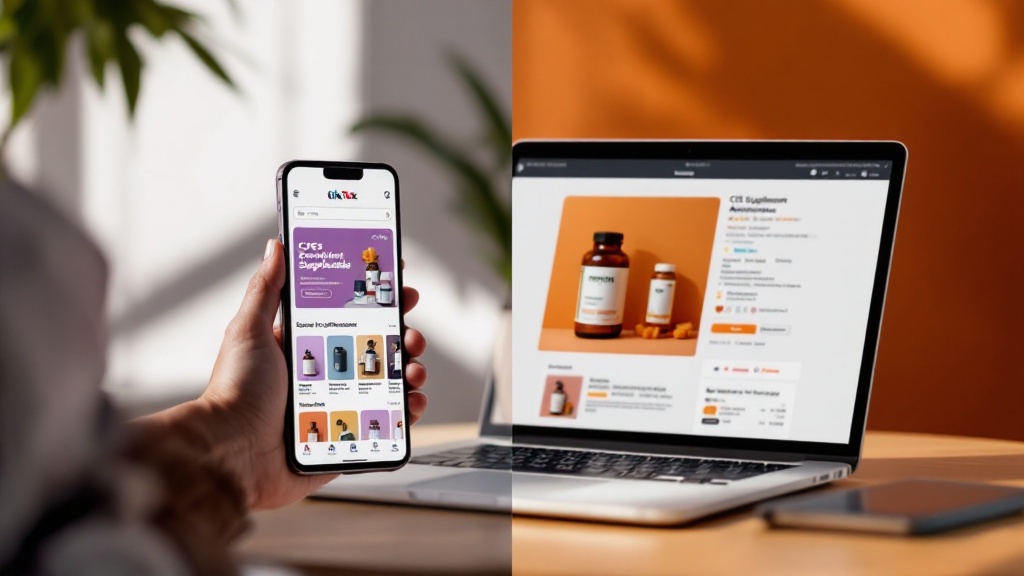
TikTok advertising is content-driven, not keyword-driven. A video hook that converts at 4.2 percent this Tuesday may be dead by Friday. Trends move in days, not weeks. That means the analytical infrastructure your agency uses needs to go far deeper than views, click-through rates, and platform-reported ROAS.
The brands scaling past $200K per month on TikTok Shop are not relying on TikTok's native dashboard. They are using third-party intelligence platforms that connect ad spend directly to product-level revenue outcomes. That connection, ad spend to SKU revenue, is the entire game.
What Good Ad Intelligence Actually Looks Like
There are several platforms worth understanding when evaluating how a partner manages your TikTok ad program. According to FastMoss, the most capable tools in 2026 share a few critical capabilities that separate intelligence from noise:
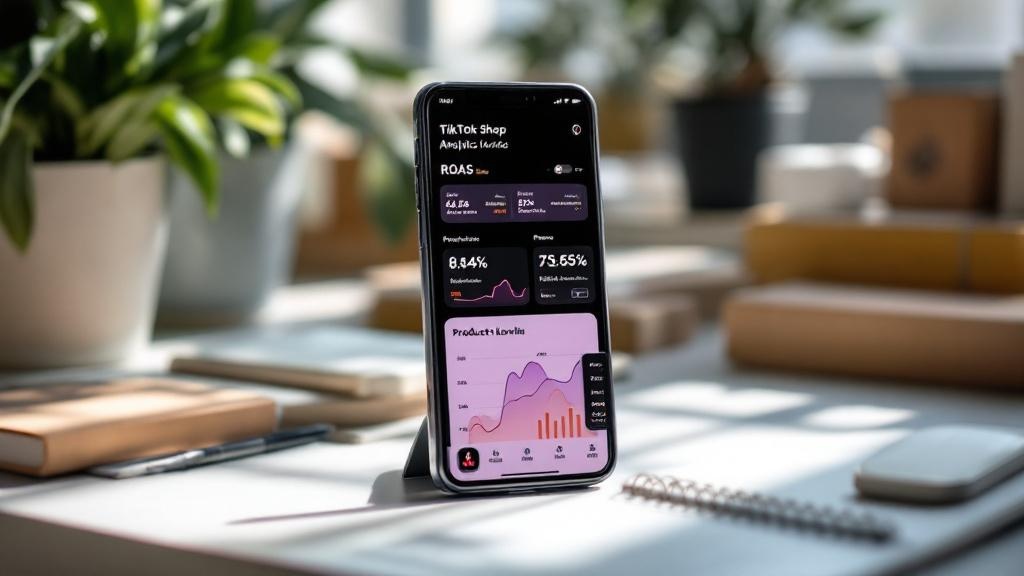
- Product-level ad attribution: The tool should identify which products are generating revenue from paid spend, not just which videos are getting views. A creative that drives 50,000 views on a product with zero conversions is a cost center, not an asset.
- Full ROAS visibility: Connecting ad spend, GMV, and margin into one clean performance chain. If your agency is reporting ROAS without tying it to net revenue per unit, the number is decorative.
- Creative structure diagnostics: Breaking down hooks, pacing, storytelling arcs, and calls to action at the video level. Knowing that a 3-second hook outperforms a 5-second one on your category is a repeatable advantage.
- Competitor scaling signals: Tracking when competitors increase ad frequency on specific creatives. Rising frequency on a competitor ad is a signal they found a winner. Your agency should be flagging that within 48 hours.
- Conversion path analysis: Attribution that traces the path from video view to product page to purchase, not just the view count. Views without purchase data are vanity metrics.
The Tool Landscape and What It Tells You About Your Agency
Several platforms exist in this space, each with different strengths. PiPiAds and BigSpy carry large creative libraries useful for inspiration and trend spotting. Kalodata focuses on product and creator analytics. Minea tracks ads across multiple platforms simultaneously. TikTok's own Creative Center offers official data but with limited attribution depth.
FastMoss sits in a distinct position because it connects the creative layer to the revenue layer at the product level, making it particularly relevant for CPG brands managing multiple SKUs across an active TikTok Shop catalog.
Here is why this matters for brand owners: the tool your agency uses is a direct signal of how seriously they take performance accountability. An agency running your TikTok Shop off TikTok's native dashboard and a creative inspiration library is not optimizing, they are guessing at scale. A serious operator has a defined stack, a defined testing cadence, and a defined threshold for killing underperforming creatives before they drain budget.
What to Demand From a TikTok Shop Partner
When evaluating a TikTok Shop management partner, the analytics question is non-negotiable. Ask them specifically:
- Which tool do you use to attribute ad spend to SKU-level revenue?
- How quickly do you identify and kill underperforming creatives?
- How do you track competitor ad scaling activity in our category?
- What does your creative testing cadence look like, and how many variants do you run per week?
A partner who cannot answer these questions with specifics is not operating at the level your brand needs to scale. The difference between a 1.8x ROAS and a 4.1x ROAS on TikTok Shop almost always comes down to how fast an operator can identify winning creative structures, double down on them, and cut losing spend before it compounds.
Aligned Incentives Change Everything
One structural reality that most brands overlook: agencies paid on flat retainers have no financial reason to obsess over your ROAS. A partner with skin in the outcome, whether through performance-based fees or a 3P distribution model where they own inventory risk alongside you, will use these tools very differently. When margin is shared, the analytics become an operational necessity rather than a reporting formality.
Eleviam operates as both an agency partner and an exclusive 3P distributor on Amazon and TikTok Shop. That structure means our team's economics are tied directly to how efficiently your ad spend converts to revenue. We are not reporting on your performance. We are accountable to it.
Running $75k+/month on Amazon or TikTok Shop? Book a free 30-minute audit call and we'll show you exactly where the margin is leaking.
Book a Free Call →